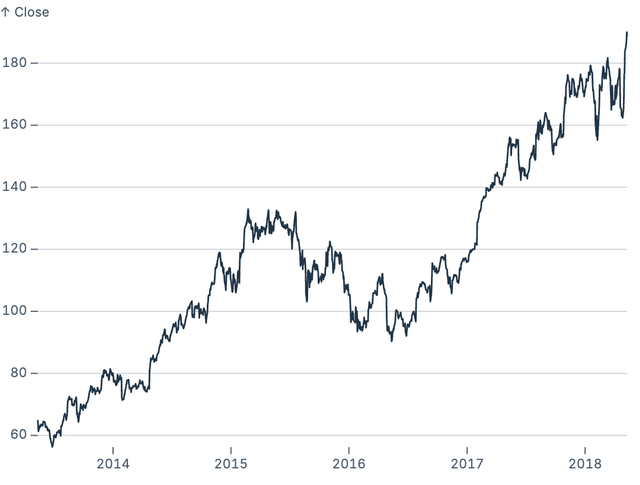
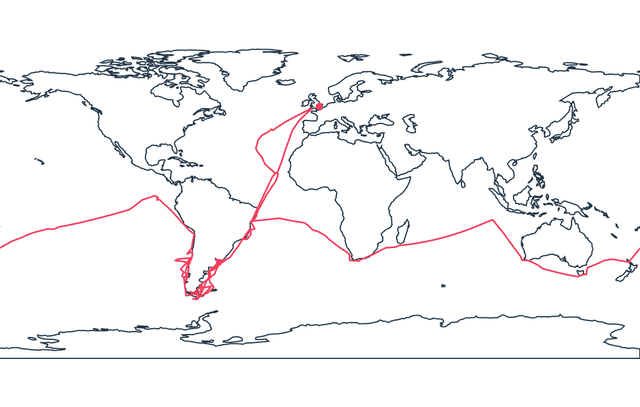
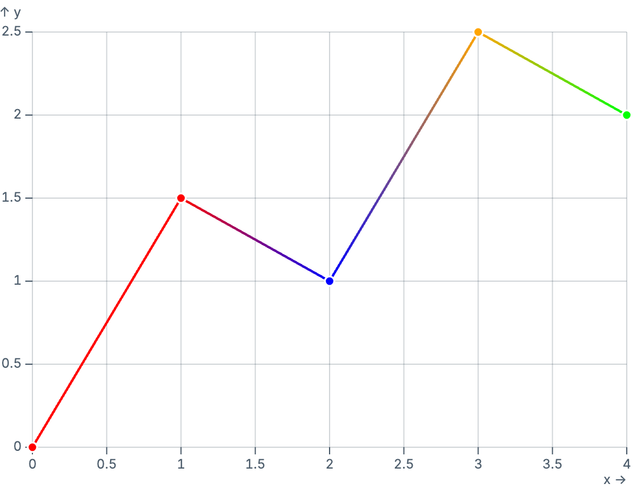
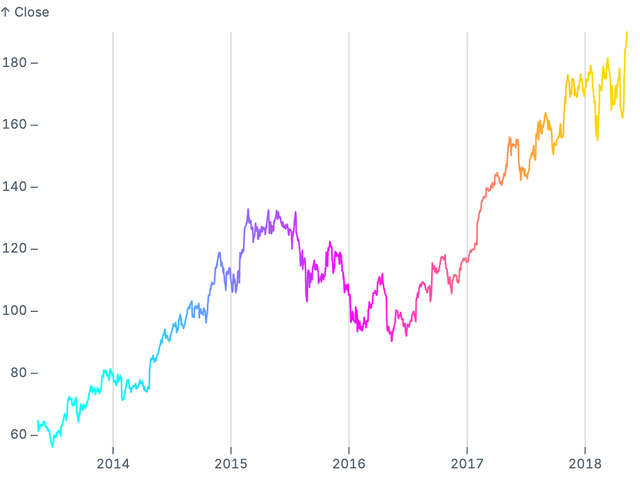
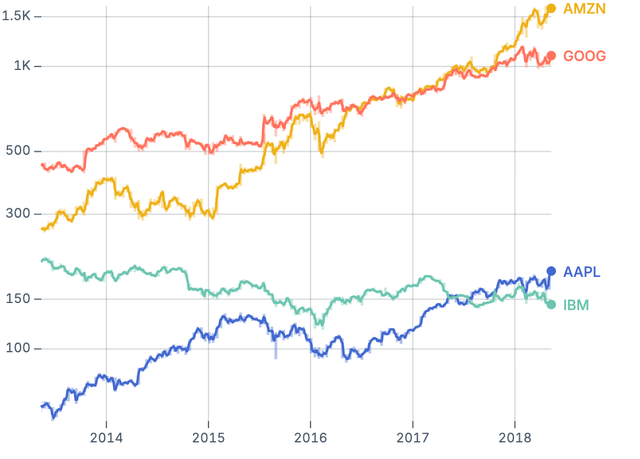
On this page
SveltePlot SveltePlot
Guide
Getting started Why SveltePlot? Examples
Features
Plot Marks Scales Transforms Facets
Marks
Area Arrow Axis Bar Bollinger Box Brush Cell Custom Difference Dot Frame Geo Grid Image Line Link Pointer Rect Regression Rule Text Tick Vector Waffle
Transforms
Bin Dodge Filter Group Interval Jitter Map Normalize Select Shift Sort Stack Window
Advanced use
Markers Transforms Projections Interactivity Defaults Gradients
Examples

line

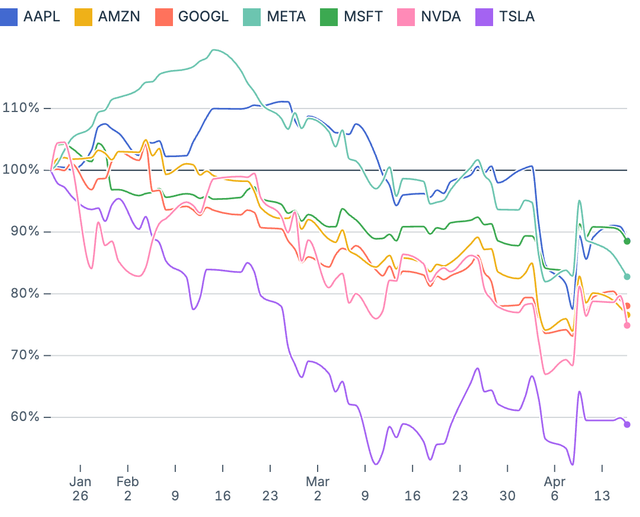
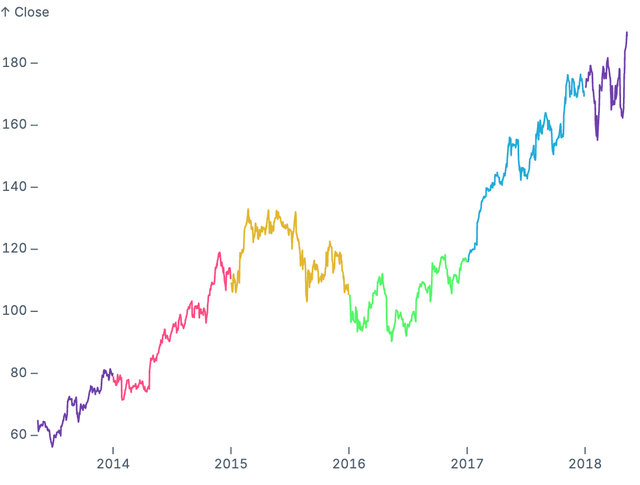
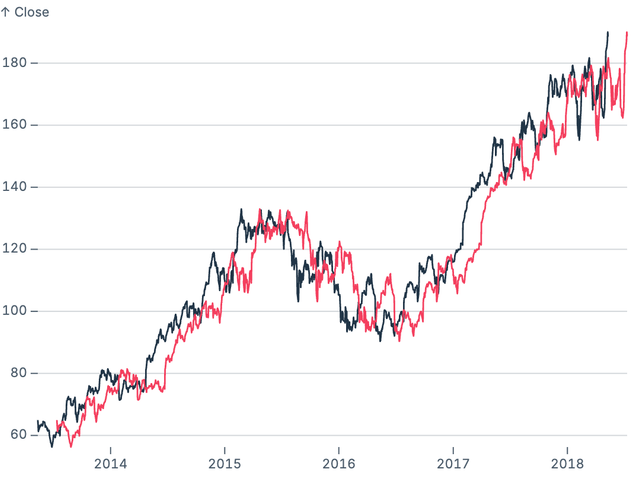
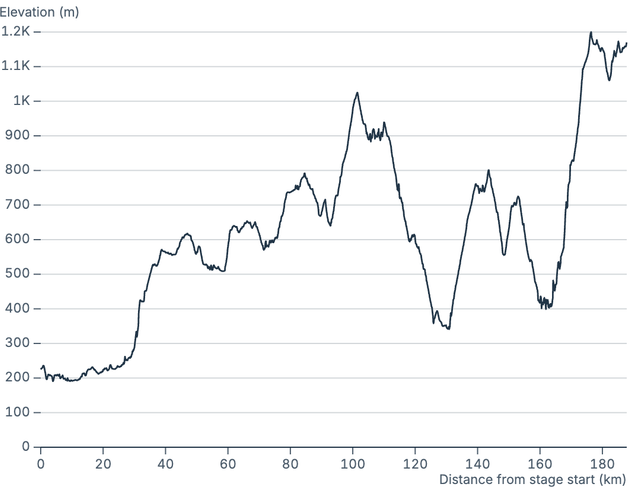
Examples showing the use of the line mark. Some of the examples here are based on examples from the wonderful Observable Plot examples gallery.

Simple line

Simple line

Geo line

Geo line

Gradient from categories

Gradient from categories

Gradient line

Gradient line

Indexed stocks

Indexed stocks

Line grouping

Line grouping

Shifted line

Shifted line

Elevation profile

Elevation profile

Running mean

Running mean

Parallel coordinates (1)

Parallel coordinates (1)

Parallel coordinates (2)

Parallel coordinates (2)

Parallel coordinates (3)

Parallel coordinates (3)

Improve this page
Last update at: 2025/11/24